Project Type: AI-Assisted Simulation | Fictional Data
Project Overview
This project demonstrates how business performance data can be organized, visualized, and interpreted to support operational and strategic decisions.
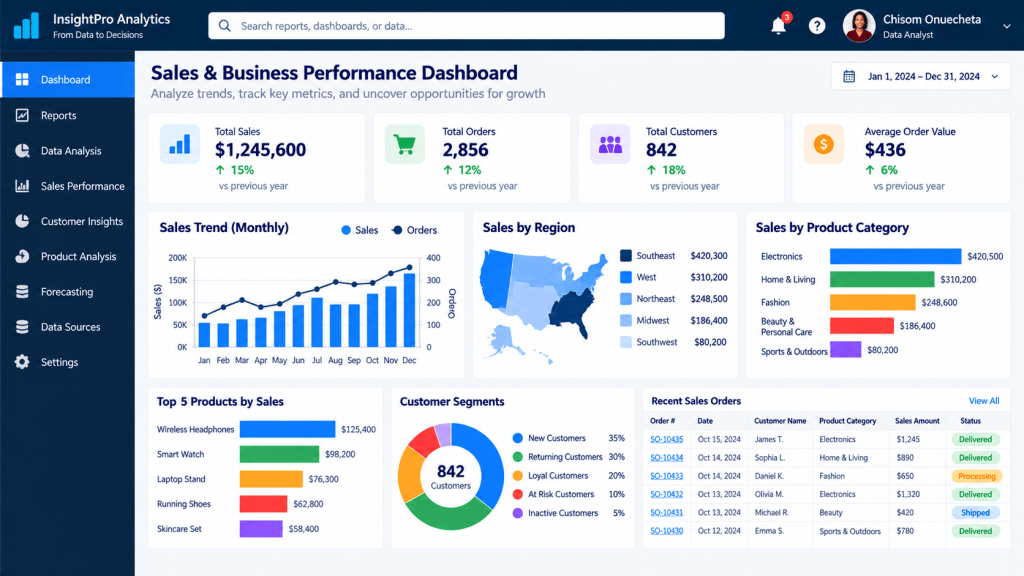
The simulated dashboard presents sales performance, customer activity, product categories, and regional trends.
Business Questions Explored
- How does sales performance change across months?
- Which regions contribute the most revenue?
- Which product categories generate the highest sales?
- How can customer segmentation support business decisions?
- Which performance indicators should management monitor?
Dashboard Highlights
- Total Sales: $1,245,600
- Total Orders: 2,856
- Total Customers: 842
- Average Order Value: Approximately $436
Analytical Skills Demonstrated
KPI Identification | Business Reporting | Data Visualization Concepts | Trend Analysis | Customer Segmentation | Business Performance Monitoring
Business Recommendations
Based on the illustrative dashboard, management could investigate the factors behind stronger sales months, review opportunities in lower-performing regions, and examine customer retention strategies.
These are preliminary observations rather than conclusions from a validated dataset.
Portfolio disclosure: This is an AI-generated dashboard using fictional data. It is a visual simulation, not a functioning Power BI report or evidence of analysis performed on an underlying dataset.

